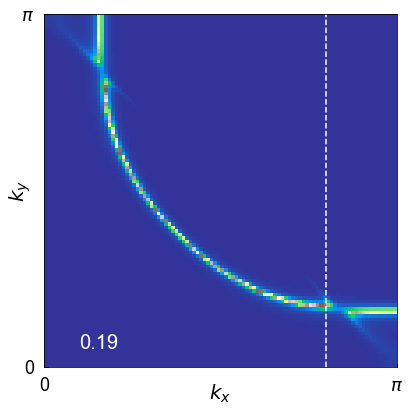
Colour plot of data in a tab-delimited file: Grid019.txt
import matplotlib.pyplot as plt
import numpy as np
import matplotlib
import matplotlib.cm as cm


# Say, "the default sans-serif font is COMIC SANS"
matplotlib.rcParams['font.sans-serif'] = "Arial"
# Then, "ALWAYS use sans-serif fonts"
matplotlib.rcParams['font.family'] = "sans-serif"
matplotlib.rcParams['mathtext.fontset'] = 'dejavusans' #dejavusans'


# Create the figure
fig1 = plt.figure(figsize=(7,7))
ax1 = fig1.add_axes([0,0,0.7,0.7])


# Some variables

lfsize = 20 #label font size
tfsize = 18 #tick font size

xlabel = r'$\mathit{k_x}$'
ylabel = r'$\mathit{k_y}$'

x1 = 0
x2 = 1

y1 = 0
y2 = 1


# File information
files = ['Grid019.txt']
delim = '\t' # Data delimiter
p = ['0.19'] # Data label
nrows, ncols = 100, 100 # Number of rows and columns


# Load and plot the data
data = np.loadtxt(files[0],delimiter=delim)
datagrid = data.reshape((nrows, ncols))
im1 = ax1.imshow(datagrid, interpolation='nearest', extent=(x1,x2,y1,y2), cmap=cm.terrain,origin='lower',vmin = 0, vmax = 100)


# Uncomment the line below to show the color bar
#fig1.colorbar(im1, ax=ax1)


# Style the axes
ax1.tick_params('both', labelsize=tfsize, width=1,direction='in', pad=10);

ax1.set_xlabel(xlabel, fontsize=lfsize,labelpad=-12)
ax1.set_ylabel(ylabel,fontsize=lfsize,labelpad=-12)

ax1.set_xlim(x1,x2);
ax1.set_ylim(y1,y2)

ax1.set_xticks(np.arange(0, 1.2, step=1))
ax1.set_yticks(np.arange(0, 1.2, step=1))

ax1.set_yticklabels([0,'$\pi$'])
ax1.set_xticklabels([0,'$\pi$'])

ax1.set_aspect('equal')

ax1.text(0.1,0.05,p[0],color='white',fontsize=lfsize,transform=ax1.transAxes)

ax1.axvline(x=0.80, ymin=0, ymax=1, linestyle="--",color='white')


# Save the plot
outfile = 'color_plot2.png'
plt.savefig(outfile, format="png", bbox_inches='tight')
plt.show()