import numpy as np
import matplotlib
import matplotlib.pyplot as plt
matplotlib.rcParams['font.sans-serif'] = "Arial"
# Then, "ALWAYS use sans-serif fonts"
matplotlib.rcParams['font.family'] = "sans-serif"
# Create some data
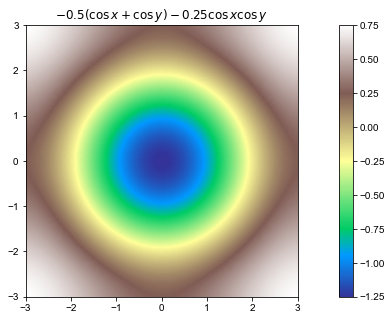
x = np.arange(-3.0, 3.01, 0.01)
y = np.arange(-3.0, 3.01, 0.01)
X, Y = np.meshgrid(x, y)
Z = -0.5*(np.cos(X)+np.cos(Y))-0.25*np.cos(X)*np.cos(Y)
# Create the figure
fig = plt.figure(figsize=(15,5))
ax1 = fig.add_subplot(1,1,1)
mycmap1 = plt.get_cmap('terrain')
ax1.set_aspect('equal')
ax1.set_title('$-0.5(\cos{x}+\cos{y})-0.25\cos{x}\cos{y}$')
cf1 = ax1.imshow(Z,cmap=mycmap1,extent=[x.min(),x.max(),y.min(),y.max()],vmin = -1.25, vmax = 0.75)
fig.colorbar(cf1, ax=ax1)
outfile = 'colour_plot1.png'
# Save the plot
plt.savefig(outfile, format="png", bbox_inches='tight')
plt.show()