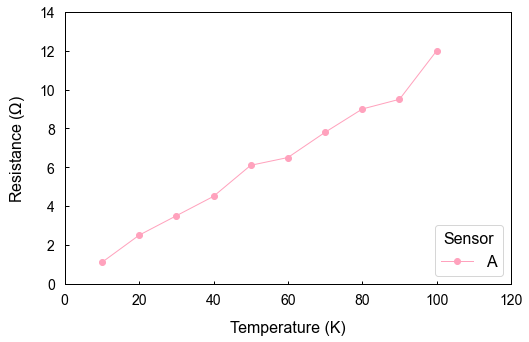
Plotting from a file called data.csv. Uses markers and a custom colour.
import numpy as np
import matplotlib
import matplotlib.pyplot as plt

matplotlib.rcParams['font.sans-serif'] = "Arial"
# Then, "ALWAYS use sans-serif fonts"
matplotlib.rcParams['font.family'] = "sans-serif"


# Our data file
file = 'data.csv'
delim = ',' #comma delimited

# Load the data into lists
T = np.loadtxt(file, delimiter=delim, unpack=True,skiprows=1,usecols=[0])
R = np.loadtxt(file, delimiter=delim, unpack=True,skiprows=1,usecols=[1])


# Some plot variables
Tlabel = 'Temperature (K)'
Rlabel = 'Resistance ($\Omega$)'

T1 = 0
T2 = 120

R1 = 0
R2 = 14

c1 = (255.0/255,162.0/255,189.0/255) # A custom colour for the plot

outfile = 'basic_plot3.png'


# Create the plot
fig = plt.figure(figsize=(8,5))
ax1 = fig.add_subplot(1,1,1)
ax1.plot(T,R, label='A', linewidth=1, linestyle="-", color=c1, marker='o')


# Set axis parameters
ax1.legend(frameon=True,title='Sensor',title_fontsize=16,fontsize=16,loc=4)

ax1.tick_params('both', labelsize=14, width=1,direction='in', pad=10);

ax1.set_xlabel(Tlabel,fontsize=16,labelpad=12)
ax1.set_xlim(T1,T2);

ax1.set_ylabel(Rlabel,fontsize=16,labelpad=12)
ax1.set_ylim(R1,R2);


ax1.spines['bottom'].set_linewidth(1)
ax1.spines['left'].set_linewidth(1)
ax1.spines['top'].set_linewidth(1)
ax1.spines['right'].set_linewidth(1)


# Save the plot
plt.savefig(outfile, format="png", bbox_inches='tight')
plt.show()