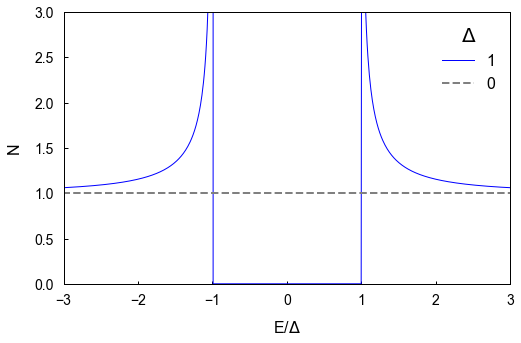
Added a second curve, changed the font sizes, axis tick directions and line thicknesses.
import numpy as np
import matplotlib
import matplotlib.pyplot as plt

matplotlib.rcParams['font.sans-serif'] = "Arial"
# Then, "ALWAYS use sans-serif fonts"
matplotlib.rcParams['font.family'] = "sans-serif"


# The density of states function to plot
def dos(E,D):
    if np.abs(E)>D:
        return np.abs(E)/np.sqrt(E**2-D**2)
    else:
        return 0


# Create lists of 'x' and 'y' values to plot
Elist = np.arange(-4,4,0.01)
doslist = []
doslist2 = []

for Eval in Elist:
    doslist.append(dos(Eval,1))
    doslist2.append(dos(Eval,0))


# Some plot variables
Elabel = 'E/$\Delta$'
Doslabel = 'N'

E1 = -3
E2 = 3

Dos1 = 0
Dos2 = 3

outfile = 'basic_plot2.png'


# Create the plot
fig = plt.figure(figsize=(8,5))
ax1 = fig.add_subplot(1,1,1)
ax1.plot(Elist,doslist, label=1, linewidth=1, linestyle="-", color='blue')
ax1.plot(Elist,doslist2, label=0, linewidth=2, linestyle="--", color='gray')


# Set axis parameters
ax1.legend(frameon=False,title='$\Delta$',title_fontsize=20,fontsize=16,loc=1)

ax1.tick_params('both', labelsize=14, width=1,direction='in', pad=10);

ax1.set_xlabel(Elabel,fontsize=16,labelpad=12)
ax1.set_xlim(E1,E2);

ax1.set_ylabel(Doslabel,fontsize=16,labelpad=12)
ax1.set_ylim(Dos1,Dos2);

ax1.spines['bottom'].set_linewidth(1)
ax1.spines['left'].set_linewidth(1)
ax1.spines['top'].set_linewidth(1)
ax1.spines['right'].set_linewidth(1)


# Save the plot
plt.savefig(outfile, format="png", bbox_inches='tight')
plt.show()